South Burlington
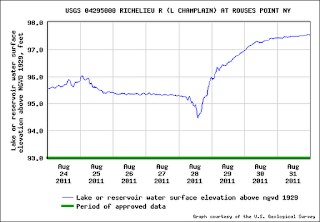
Here is some interesting data. The three graphs below show the Lake Champlain level last year. August 28 was the day Tropical Storm Irene hit. Note the difference in levels at Burlington (mid lake), Rouses Point (north end) and Whitehall (south end). Irene's wind were from the north which caused the level to go down initially at the north end. Then a north-south slosh action like a bathtub starts in. In this case, the south end at Whitehall didn't follow the simple slosh because it was flooded from both the north and the south.


Below is another interesting graph. This one shows the lake level for two years. Compare the spring floods in March 2011 with March 2012. Blog readers will remember that we avoided Champlain in June 2011 because of the flood conditions. Obviously, the lack of snow last winter cause the low levels today. I also note with interest that there must have been a heck of a storm around October 1, 2010, nearly comparable to Irene in lake level effects. We were not on the lake that month.


No comments:
Post a Comment
Type your comments here.
Note: Only a member of this blog may post a comment.