After some discussion with friends about sailing the inside passage between Marathon and Biscayne Bay, I decided to do a little research on the tides in that region. What I learned is very interesting. All the data below pertains to the tide station at Vaca Cut, Florida.
The pie chart shows the components of tidal variation. The repeated pattern 1/2 to 1 is very interesting. 1/2 day, 1 day, 1/2 lunar month, 1 lunar month, 1/2 year, 1 year. The proportions of the pie vary according to location. For example, in Pensacola, Florida there is almost zero 1/2 day component of tide. They have only one high and one low tide per day.


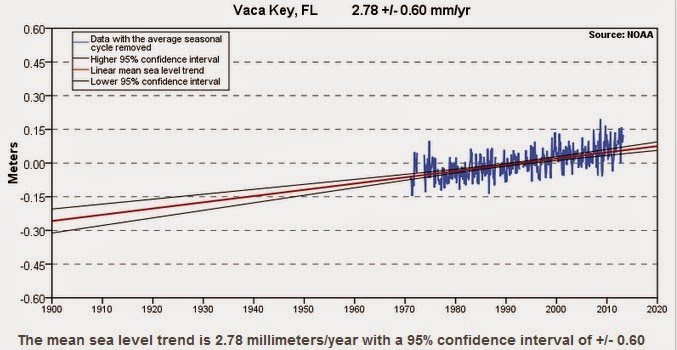
Below is the sea level trend. Does this mean global warming? I don't know. But the rate of 3mm/year is pretty slow in any case.
I can also see a definite component with a 9 year period. I posted a question about this on an oceanographer forum. I learned that there is a 9 year period to the precession of the moon's perigee, and a 18 year period of the precession of the moon's plane. Wow, imagine observing such sophisticated astronomical things just by keeping records of tides. Amazing.


No comments:
Post a Comment
Type your comments here.
Note: Only a member of this blog may post a comment.